Bitcoin Report – August 2025
Posted on 21/08/2025 | 392 Views
Today our Independent Research Analyst, Isaac Ho from the Ainslie Research Team brings you the latest monthly deep dive specifically on Bitcoin – including market analysis, on-chain metrics, sentiment, and technical analysis. He highlights some of the key charts that were discussed and analysed by our expert panel in the latest Beyond the Block episode and expands upon his work with some additional insights. We encourage you to watch the video of the original presentation if you haven’t already.
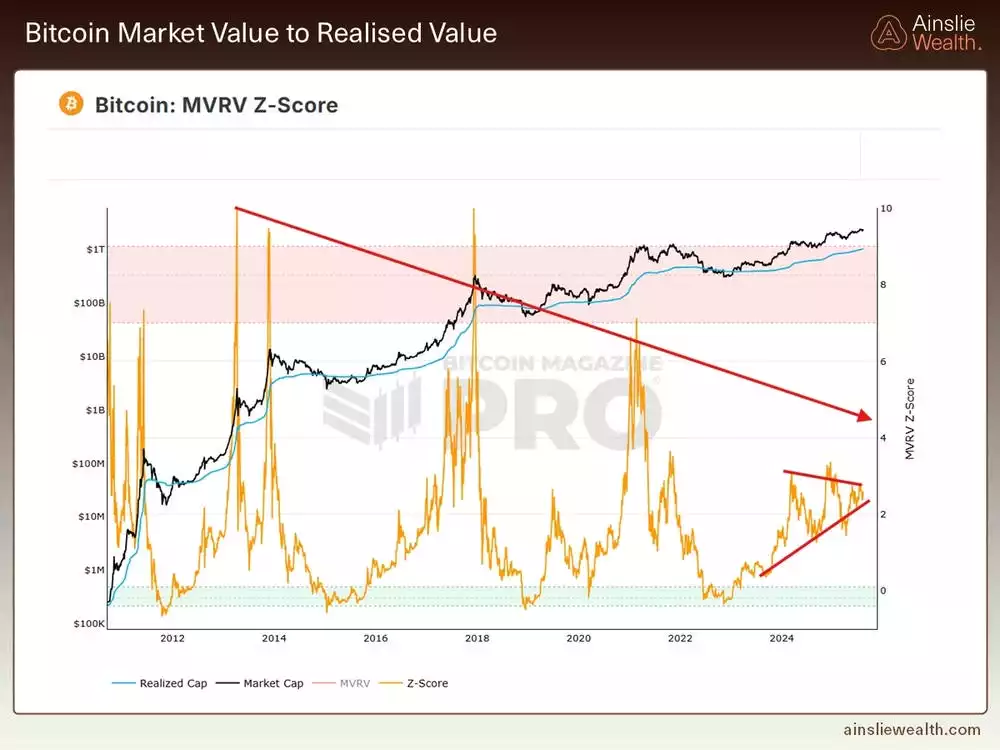
MVRV Ratio Compression & Market Implications
Looking at the MVRV ratio, we’re seeing a clear compression in the degree of deviation—largely due to the fact that price action has been more muted compared to previous cycles. This can be interpreted in both positive and negative lights. Realistically, though, a deviation of 10+ is unlikely at this stage. Such a move would place Bitcoin in an extremely overvalued zone, which doesn’t align with where we are in the cycle or the current liquidity environment. Based on ongoing compression, a more realistic expectation is a deviation in the high 3 to 4 range.
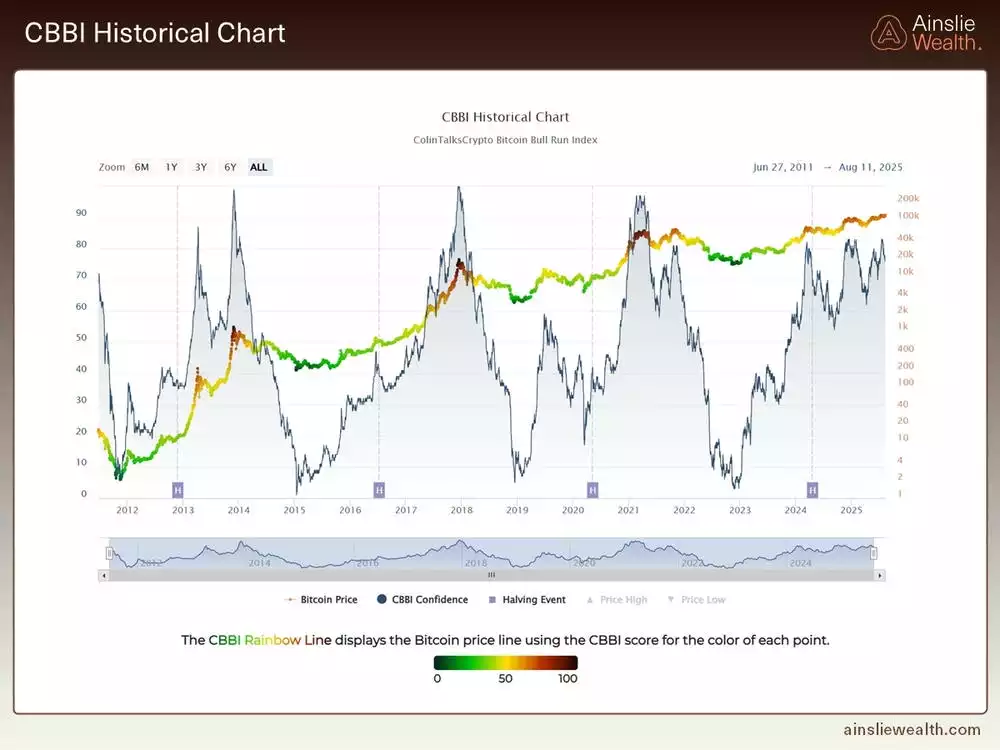
CBBI
The CBBI is a composite chart that incorporates seven major indicators. So far this cycle, it has flagged three significant periods of overheated price action, each followed by extended sideways consolidation. Importantly, those who sold heavily at the first sign of “red” on the chart would have missed substantial nominal gains. The CBBI is best viewed not as a hard metric but as a broad sentiment gauge—particularly in this cycle, where retail activity is subdued and institutional participation is more dominant.
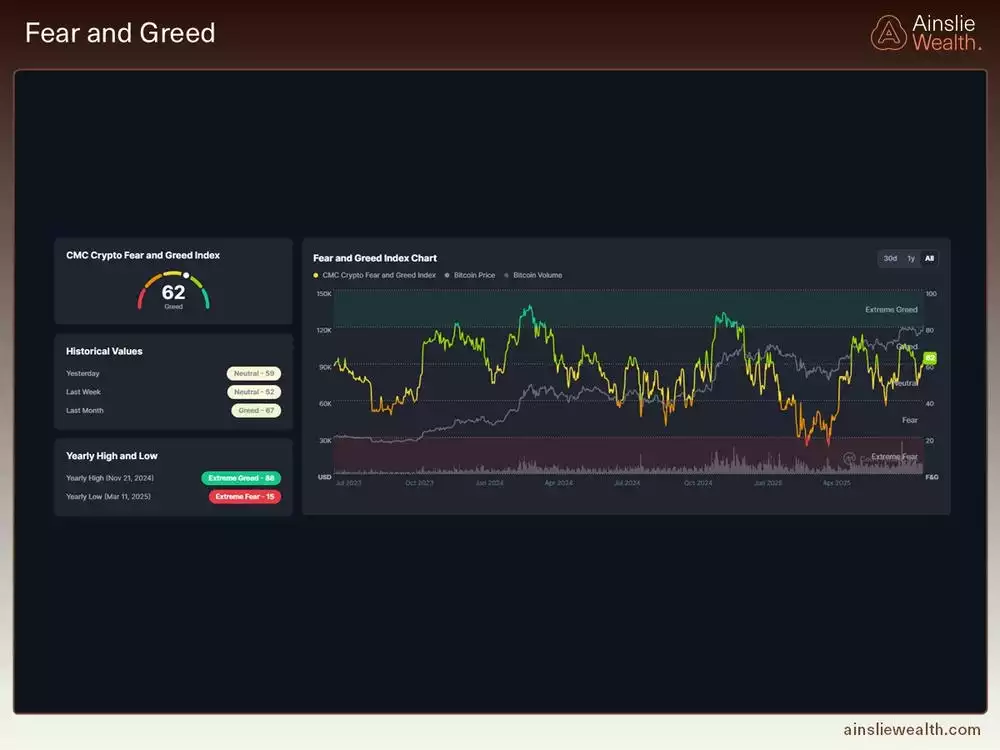
Cycle Behaviour & Sentiment Patterns
Over the past two years, price has oscillated between extremes, often marking prime entry points. However, we now appear to be entering a more volatile, emotionally driven stage of the cycle—typical of late bull markets. Sentiment metrics are forming a triangle pattern, signalling growing indecision. A breakout from this structure is likely, and given current liquidity and timing dynamics, an upward move remains the most plausible. That said, short-term volatility and pullbacks are still on the table.
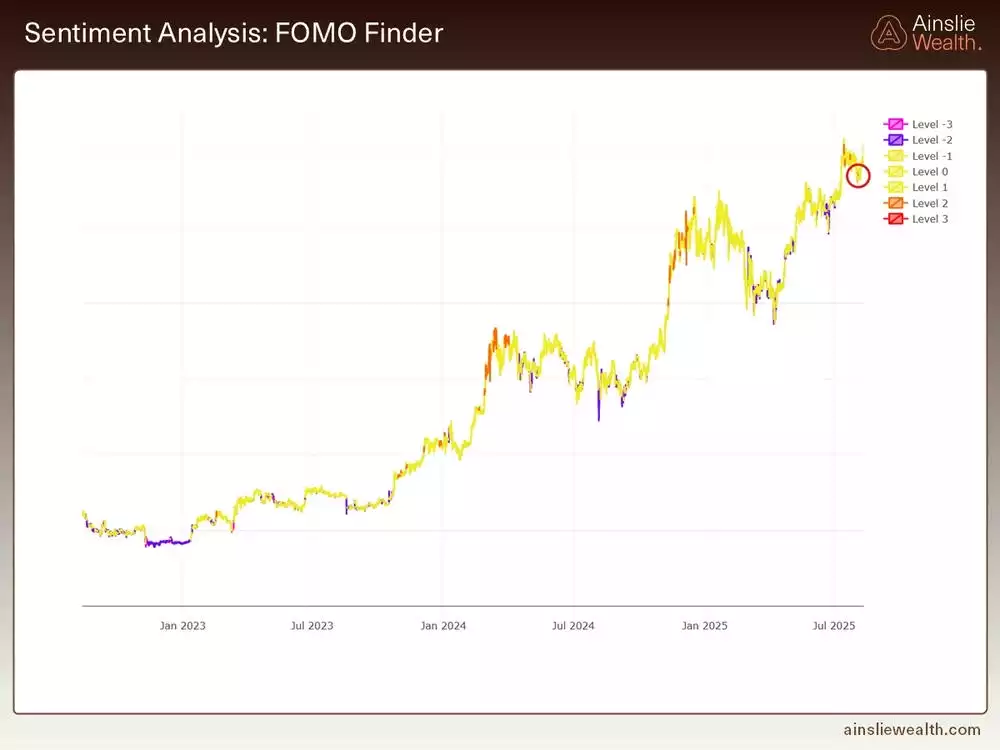
FOMO Finder & Sentiment Signals
The FOMO Finder, another sentiment tool displayed via colour-coded signals, uses a different algorithm but tells a similar story to the CoinMarketCap sentiment metric. One consistent takeaway: when price enters the “purple” fear zone, it has repeatedly marked strong Bitcoin buying opportunities throughout this bull run—something we’ve regularly highlighted in these updates.
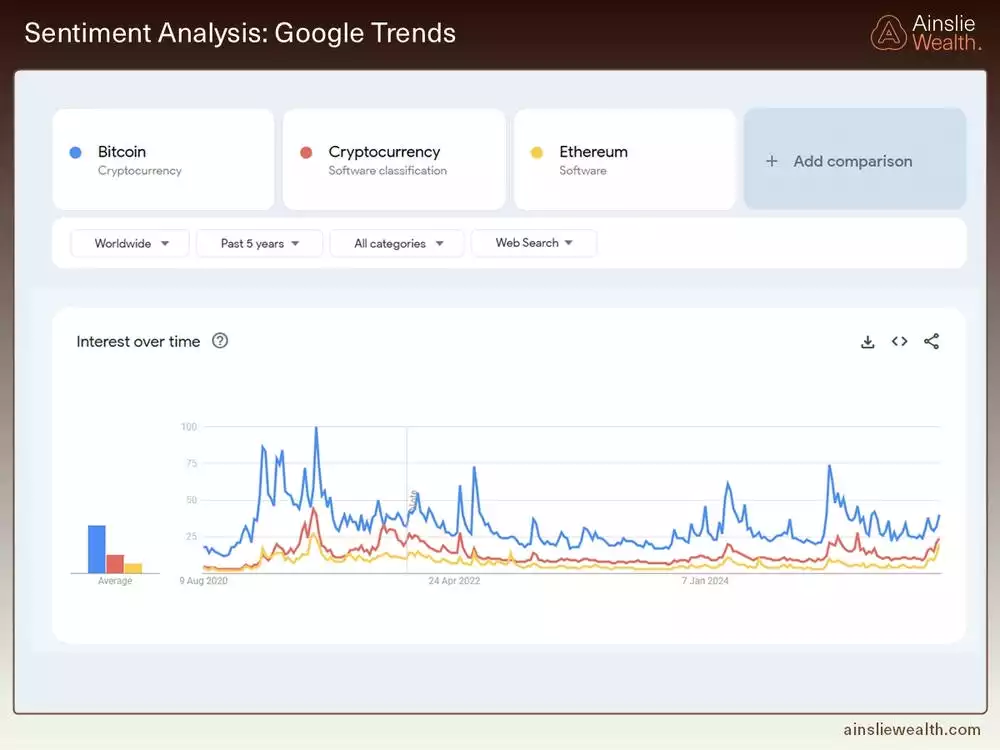
Google Trends & Retail Behaviour
Google search interest remains underwhelming, with only a slight uptick—despite Bitcoin trading near all-time highs. In our view, this is bullish. It suggests retail investors are still largely absent, leaving room for further upside when they inevitably re-enter, likely near the top. While this may not mirror the retail mania of previous cycles, the psychology remains consistent: FOMO is hardwired, and once triggered, tends to be relentless.
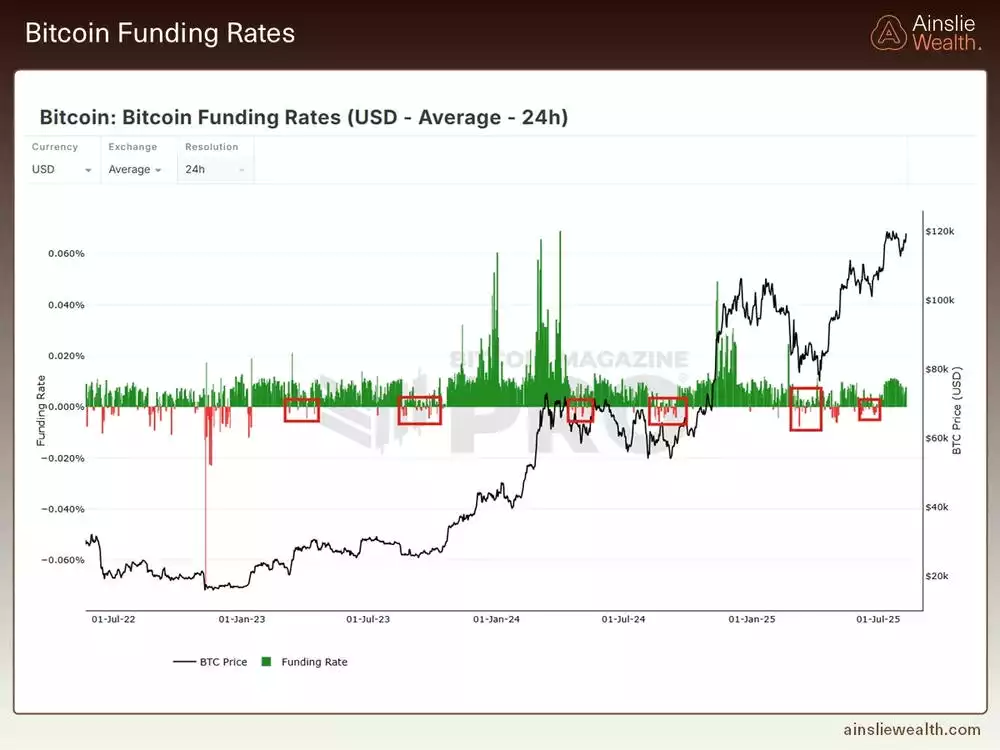
Funding Rates – Still Cool
Funding rates, one of the most objective sentiment metrics, are telling us the market is far from overheated. We’ve yet to see the kind of spikes that typically precede a cycle top. Elevated funding rates occur when long positions pay shorts—an indicator of excessive optimism. Current levels suggest plenty of room for further upside.
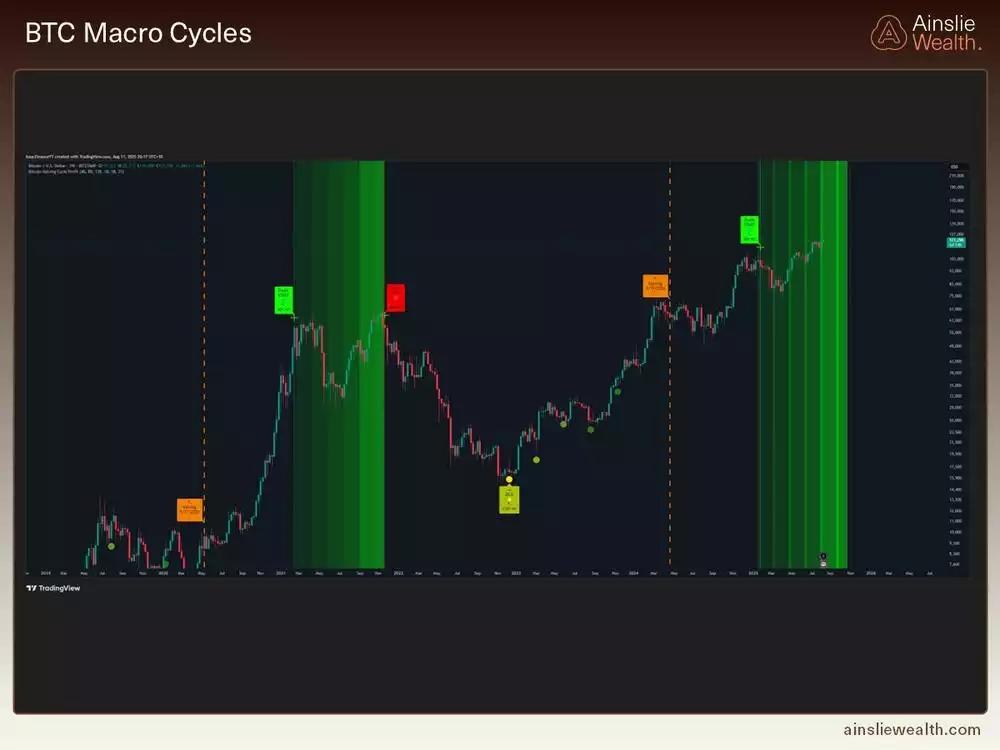
Macro Cycle Positioning
The Bitcoin Macro Cycle chart offers a visual guide to bias shifts—and we’re now entering the phase where vigilance is critical. Historically, every cycle top has formed within this timing window. While a Q1 2026 top remains possible, we’re now in the zone where failed rallies, sentiment spikes followed by rejections, and other key signals must be closely watched.
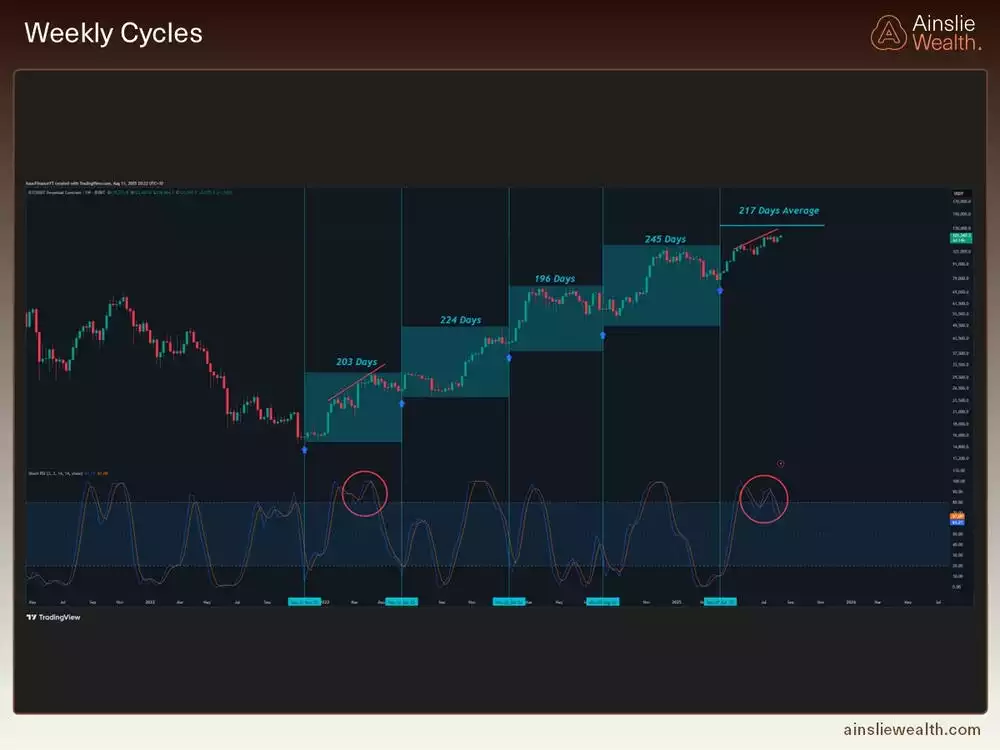
Structure vs. Liquidity
While market structure remains technically bullish, we’re nearing a potential inflection point. It’s important not to rely too heavily on pattern repetition; similar visuals don’t guarantee similar outcomes. Liquidity, rather than structure alone, will be the more telling guide moving forward.
Local Market Levels to Watch
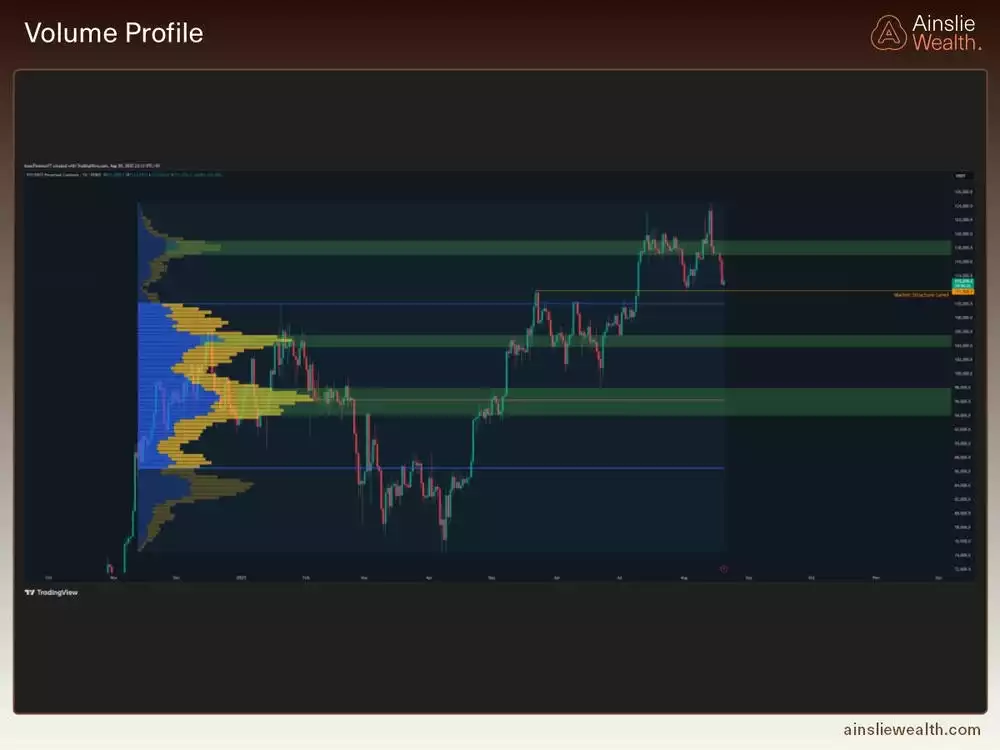
Locally, price has broken below the highest volume node and is currently testing the $111K level—a key structural threshold. A short dip below is acceptable, but consistent closes beneath this level on the daily and weekly charts would indicate weakness and raise the risk of a deeper correction—or even a potential cycle top, however unlikely that may seem. In short, brief moves below are tolerable, but sustained weakness here would be a significant red flag.
Watch the most recent video presentation of Bitcoin Analysis: Beyond the Block where we share some of these explanations in a panel format, and join the discussion on our YouTube Channel here:
We will return with a more detailed analysis of everything Bitcoin next month, including more market analysis, on-chain metrics, sentiment, and technical analysis.
Isaac Ho
Independent Research Analyst
The Ainslie Group
x.com/IsaacsDevCorner